Market Metrics Analysis
View statistics on the current market
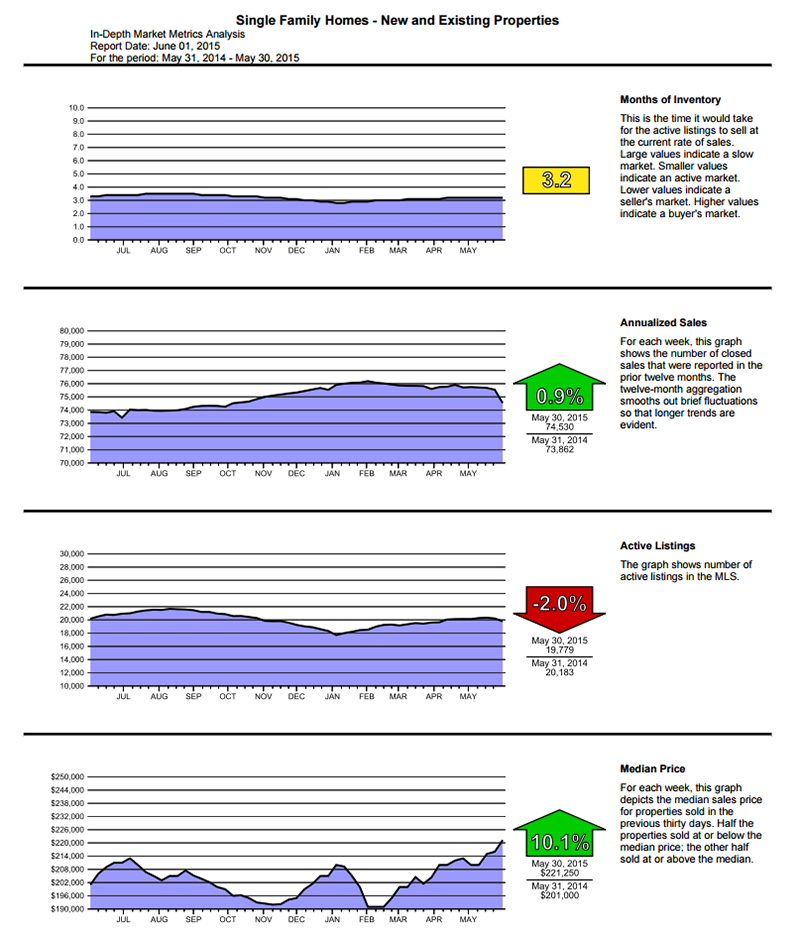
The Market Metrics Analysis provides months inventory for single family homes, townhouses, and highrise condominiums and annualized sales for each. Months inventory is the time it would take for the active listings to sell at the current rate of sales. Large values indicate a slow market. Smaller values indicate an active market. An inventory of 9 – 10 months indicates market equilibrium. Lower values indicate a seller’s market. Higher values indicate a buyer’s market. The annualized sales report provides a graph that shows the number of closed sales that were reported in the prior twelve months. The twelve-month aggregation smooths out brief fluctuations so that longer trends are evident.